
Auditing Your Mobile/Web Traffic Performance

Looking through our content and evaluating its success can be deceitful sometimes. How do we determine the quality of traffic, whether it helps us achieve our goals?
If you go to the Acquisition area and click on the Overview report, it will show the common channels that folks are using to access your website. Channels that are defined based on different criteria, like an organic search or a paid search. You can view them as a whole, but the best way to learn more about what, when and why brings traffic to your website is to check out the Source/Medium, an option that shows you how somebody reached your mobile or web application. Source represents who send that person to your website, while Medium is how they got there.
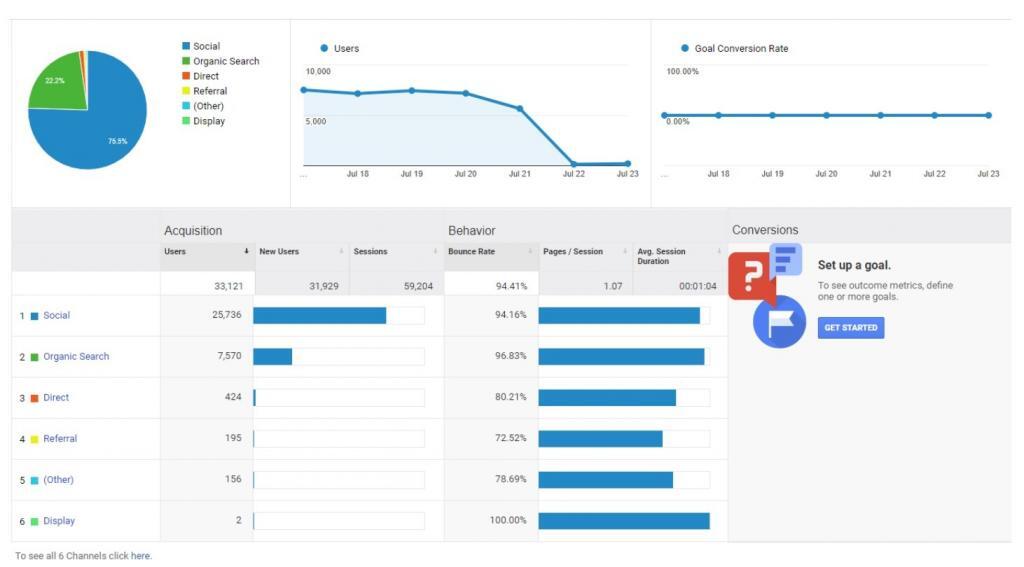
A good way to tell if traffic is performing is to check out the revenue. With eCommerce on your website, you can easily see this report, but if you had set goals, then you can look at the All goals area, in order to find out how many goal completions are happening for each traffic source. Basically, you’re discovering what percentage of your visits from this traffic source is very successful. Organic search by Google needs to be upfront, as well as direct visits, of course.
Goal conversion rate percentage can sometimes be a little deceiving because some source can convert well, while others can be rock bottom. If you’re taking conclusions just based on the average conversion, then you’re not finding out the whole story. With all this data in hand, you can make decisions, like cutting down the “ill” source or produce solutions to better understand why that source is performing so poorly.
Building advanced segments
There are metrics that matter and some that don’t matter that much. It’s essential for us to spot which is what, in order to prevail incorrectly evaluating our content. The first step is to access the Overview of our content and click on the All Pages report. Bounce Rate shows how much you attract the interest of a possible customer. If he leaves after accessing just one page, then you’re doing a poor job and need to find a solution in order to make people stay more on your website.
A high Bounce Rate means that individuals don’t seem to be interested in your website and aren’t going deeper than one page.
But there is also a good part – 100% minus your Bounce Rate equals a conversion rate, and if that number if perfect suitable for your strategy, then all is well.
However, a better Bounce Rate on a multiple solutions page is not necessarily better than one poor Bounce Rate on a single focus landing page. That’s because you’re forcing people to make a single decision, one that benefits you. It’s all about context, if it makes sense to you and if it gives you the results you’ve wanted.
The Page Value metric informs you how much that page contributes to the bottom line of your website. This value is filled out only if you had set up goals in Google Analytics or if you had set up eCommerce. If a page has a low Page Value ($ per visit), then you should consider making it better, because, in the long run, it will help you a lot.
Looking just at the pages can be insightful, but segmentation can help in seeing how users found different pages, can assess marketing campaigns or can identify traffic sources.
If you click on the Secondary Dimension button on Google Analytics, you can type what you want to look for. This way, you can find the opportunities you’ve missed so far and you’ll have the data for you to proceed in finding new solutions.
Within a high volume of people, a simple change can mean a new revenue for your website.
Additionally, you can see the segments where everything is going well, so you won’t need to make any changes there.
Besides Secondary Dimension, you can also click on the Advanced Segment, where you can look at any segment that you think is important for your review. You can also compare two segments, side by side. Paid Traffic can be a tricky method to advance your website, but with this solution, you can see if the paid ads are going to the right place.
Evaluating traffic quality
Spotting conversion opportunities isn’t easy at all, but when everything is an opportunity to convert, you’ll always need to keep your eyes wide open.
Your traffic source is important, to see how one arrives on your website.
For example, if visitors are coming from a niche resource like the HostList web hosting directory, creating a landing page that matches their expectations can improve engagement and increase conversion rates. Then you observe on what pages they go to and how the page is structured as a conversion opportunity. If that page is successful, then add the missing step that is lacking for the user to make the next step. Finding out if there’s a problem in your shopping cart is always an opportunity to improve your conversion.
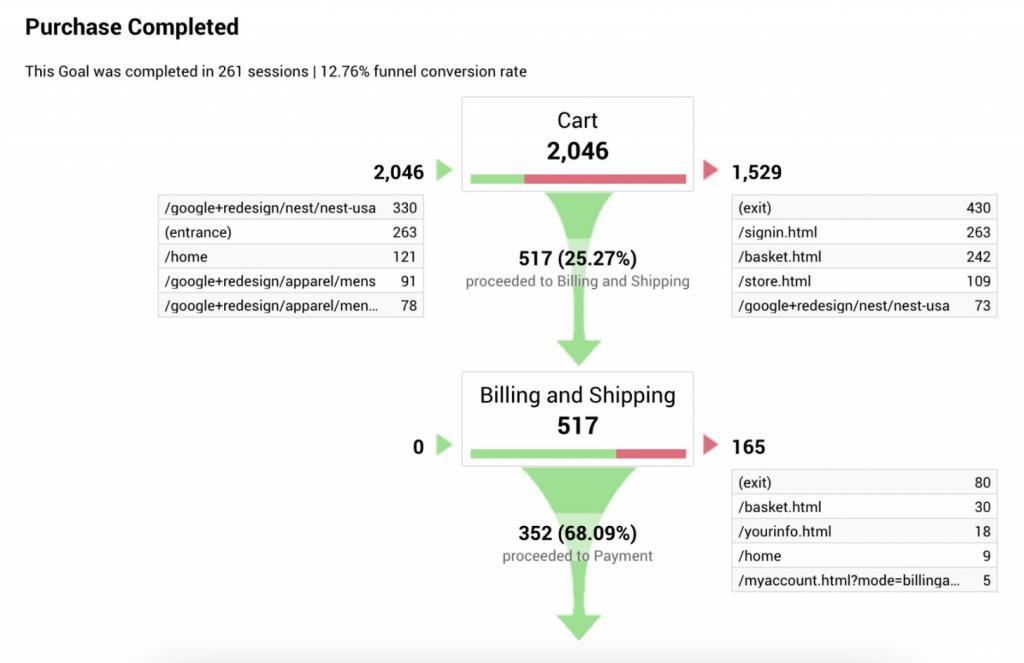
In order to clearly see these steps, just try and purchase your own product. Then, you come across the good parts but also can evaluate the reasons why your business isn’t improving, from where does the customer frustration come from.
From the Goals reports in Google Analytics, we need to pay attention to Goal Funnels. Step by step, we can see how many people went from putting products into their carts into actually buying them. You can see where there are dropouts, so solutions for that exact step or steps can be found.
There are some segments you will want to use most of the time, but building new ones is an action correlated with the data you see on your screen.
From the System report, we can compare different reports, looking at them side by side and seeing what’s different about them. With this technique, we can answer a lot of questions. Click on Apply and compare the people who bounce off your website and those individuals who took the action you wanted them to take.
Another segment you should look at is the difference between mobile traffic and tablet/desktop traffic. In most cases, mobile traffic will be bigger but will produce less page value.
Metrics: the ones that matter and the ones that don’t
We have our system generated segments, but creating our very own custom ones can offer a lot of precious information. To make one for yourself, based on different criteria and conditions, click on the New Segment button. From the Conditions option, you can choose anything that is a Secondary Dimension or a metric.
Another great aspect about this is that you can include or exclude users on your search based on your desired criteria.
You can actually build a segment based on what you know about somebody, not individuals particularly, but people who seem the same.
If you have a high traffic website, then you won’t have the entire data at your disposal and will have to deal with sampling, which is a selected subset of individuals from a population. However, with the premium version of Google Analytics, you can surpass this inconvenient.
Bounce rate is sometimes misleading, just because is not showing us all the action a user is taking, like scrolling down the page or running a video. To train Google Analytics to know what happens within your page, use Event Tracking, a method to track user interaction within your page.
Track your video interaction and see how many people have hit play, how many have paused or how much of it they have watched. In this case, you’ll figure out if it’s too long and needs a bit of change.
And with Scroll Tracking, you’ll find out how someone scrolls. The same as the video tracking tool, it shows us how far people got. So, if few users reached the bottom of the page, then it’s an indicator that you shouldn’t put all your action buttons at the bottom of the page if you want to raise your conversions.
Auditing your analytics to see if things make sense is an important process.
Look at all your goals and observe what makes the numbers happen, what brings the money to the bank. If you have a high conversion rate, but you purchase rate is way lower, is pretty bad. But at least you’re doing the right thing and seeing the problem.
Avoid setting up too many goals. Put on a couple goals so you can track them better. Furthermore, by going in the administration section, you can check what settings are in place, in order to see if products are linked, to check for self-referral exclusion, to review filters, to see if you have eCommerce setup.
Make sure that the data makes sense, especially when we’re speaking about pageviews. Errors can occur and false data can be misleading. Another thing you can do in your auditing is to scan the website to see if Google Analytics is on every single page.
And this wraps it up.
We like to believe that we managed to convince you that Google Analytics is a more than valuable asset for your business and you’re seriously missing out if you’re not using the information it provides. After all, what better way to improve your content than analyzing how the one you already have performs?
