
How to Use AI to Predict Churn If You Are An Ad-Driven Digital Publisher
In an increasingly fragmented market, reader loyalty is notoriously difficult to build and maintain. You know that all too well and so do we.
This is especially difficult if you’re a news-driven digital publisher seeking to deliver uncompromised quality. Besides, moving to a subscription-based model is not for everyone.
We’ve talked to people facing the same issues as you are and the good news is that you can still tap into a significant growth opportunity. If you’re relying on ad revenue to support your business, you can still benefit from predicting churn with AI-enhanced tools.
What is Churn Prediction and Why it Matters
For subscription-base publishers, churn forecasting entails detecting which customers are likely to cancel their subscription and how many of them might do so.
In your case, as an ad-based digital publication, readers can freely access the content you publish on the web or a number of mobile apps. However, you can still define and predict churn even if your readers are not contractual customers or subscribers.
Case in point, it’s helpful to consider the Pirate Metrics framework proposed by Dave McClure in the startup ecosystem. According to this framework, a certain user has to be retained first before the eventual churn occurs. For ad-based digital publishers like yourself, this means a loyal reader is considered to be the one who returns to your website or mobile/web application frequently.
Why We Need AI to Predict Churn
The reason we need artificial intelligence to forecast churn with increasing accuracy is simple: humans aren’t really good at analyzing a large number of signals. Imagine what it would take to build rules manually for hundreds of signals and do it at scale. It’s not feasible nor accurate. Luckily, AI can help A LOT.
Predictive analytics used to be something only big players could afford because they were the only ones with enough resources to hire data scientists and invest in technical solutions.
Luckily, teams all over the world are working to democratize AI (ourselves included). As a result, you can use our work to forecast how many of your loyal users might give up reading your content. The patterns identified in their behavioral data will guide you to address the key issues that are driving readers away.
As an ad-supported publisher, you may not handle or collect transactions data but you most likely collect:
- Product data (content preferences data)
- Marketing data (push notifications, newsletter subscriptions, time on page, etc.)
- Feedback data (comments, NPS surveys, polls, etc.)
- App events data (read recommended article, share on social media, forward to a friend, etc.).
You can use these data points as fuel for the next steps.
There are two deeply rewarding aspects about using machine learning and data science to predict churn:
- it eliminates a huge deal of guesswork
- it points decision-makers towards a course of action that scales effectively.
Churn-related insights can indicate a number of potential causes such as:
- Customer dissatisfaction with the content
- Lacking user experience
- Better offers the competition provides
- More successful sales and/or marketing competitors engage in
- Customer lifecycle issues, etc.
Creating individualized customer experiences is often an effective solution. Companies in publishing and several other fields are using this tactic increasingly often. However, the challenge is to do it at scale. This is where AI-fueled platforms, such as MorphL, help.
Churn Forecasting as an Ad-Based Publisher
If securing revenue from readers is not an option for you, investing in churn prediction can become a powerful competitive advantage.
The ability to identify when a customer/user is at high risk of churning gives you time to do something about it. By making data-informed decisions, you can potentially unlock an additional revenue source to grow your business.
Churn prediction gives you time to keep readers engaged through:
- Personalized experiences according to interests
- User retention email campaigns
- Contextual interactions
- Content improvements
- Gamification
Time to get practical and make this work for you.
Start by identifying returning users. In Google Analytics, navigate to Audience Overview and segment users by “New” vs “Returning” for a given period of time:
As you can see from this example 25% of users are in fact returning. This means this publisher’s loyal readers come back to the mobile/web application at least twice within the given time frame. Now that we’ve identified returning users, a new question pops up:
How many of the 25% are actually churning or how many of them (percentage-wise) never come back?
Again, you can use Google Analytics to explore the Cohort Analysis report:
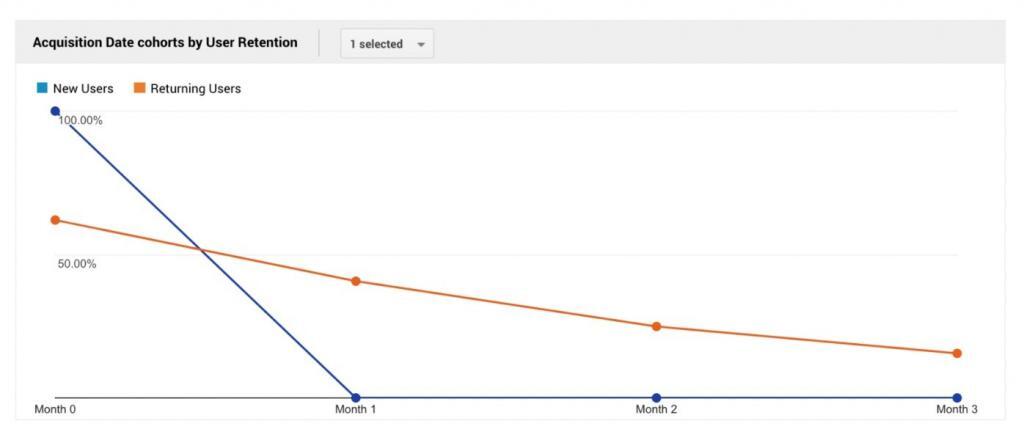
This tells us that, on average, roughly 37% of returning users are churning every month (calculated from the orange slope). We now have the churn rate for our ad-based digital publisher!
To put this number into perspective, just imagine that, at the current churn rate, by month 5 all of the returning users will be lost. With that in mind we started digging into more ways of predicting users that are about to churn and documented the entire process below.
By default, Google Analytics includes a series of handy reports. For example, you can see the total number of users and sessions on your website from a particular time interval.
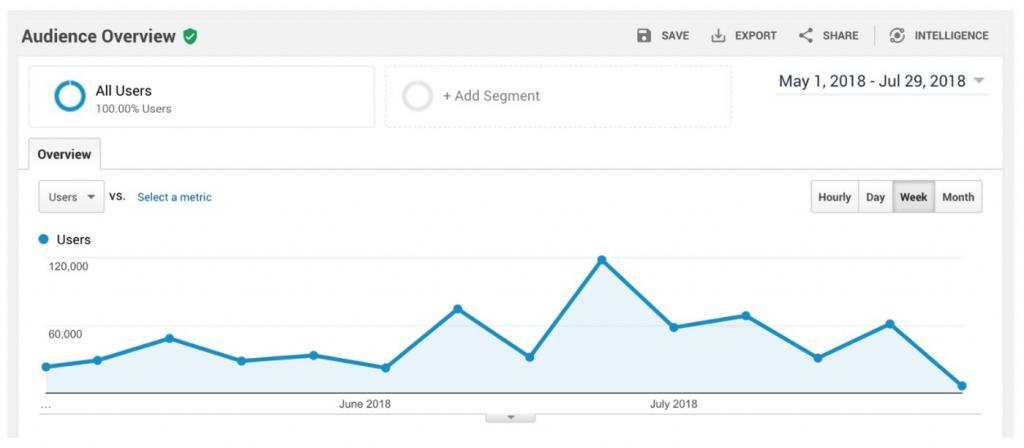
Most reports from Google Analytics use aggregated data, meaning they sum up the activity of all users.
In 2016, they added the User Explorer report to the mix which “lets you isolate and examine individual rather than aggregate user behavior”. This report is very valuable to understand the behavior of individual users so you can personalize their experience.
Good to know: The free version of the Google Analytics Reporting API v4 doesn’t export any client IDs from the User Explorer report. However, it is possible to make these available by creating a custom dimension with the same value as a Client ID. We documented this process on our Github account, so you can use it too.
This allows the analytics API to export data at the Client ID, Session or Hit level, instead of returning only aggregated data.
We should clarify that the Client ID refers to a browser, not to a user account, so, naturally it doesn’t include any personal data. It is possible to associate the Client ID with a user account (across devices) but in this particular use case all client IDs refer to browsers.
The Google Analytics Reporting API can export data at the user level, session level or hit level. Each user can have multiple sessions and each session has multiple hits.
Export and Label Data for Customer Churn Prediction
The most relevant data about a user’s history you can get from the API includes:
- Sessions (total sessions for each user per time interval)
- Session duration (total sessions duration for each user per time interval)
- Avg. session duration
- Entrances
- Bounces
- Pageviews
- Unique pageviews
- Screen Views
- Page value
- Exits
- Time on Page
- Avg. Time on Page
- Page Load Time (ms)
- Avg. Page Load Time (sec)
- Days since last session
- Count of sessions (total number of sessions for the user independent of the selected time interval)
- Hits (total hits for each user per time interval);
- Device Category (mobile, desktop or tablet)
We used Google Data Studio to export CSV files with all those columns.
The caveat is that we had to do some stitching because Google Analytics can only export 9 dimensions/metrics at a time. If you use Google Analytics 360, you won’t be bothered by this limitation.

To be able to predict if a user is going to churn or not, we first labelled the exported data as churned / not churned by calculating the average time between sessions of retained users.
As it turns out, the Avg. Days Between Sessions was 38 for one publisher and 23 days for another. In the graphics below, you can observe where these values are located on the long tail. They clearly show the majority of users return in the first couple of days after their initial visit.
In other words, if a user has a value of Days Since Last Session > Avg. Days Between Sessions, he is labeled as churned.
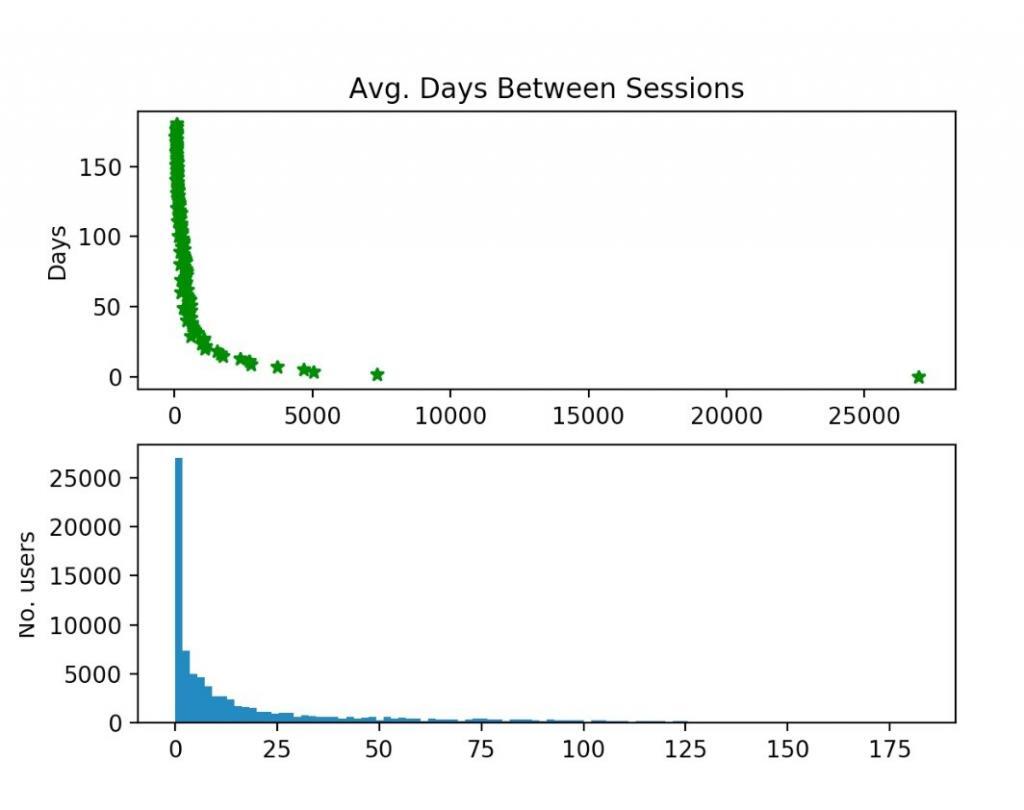
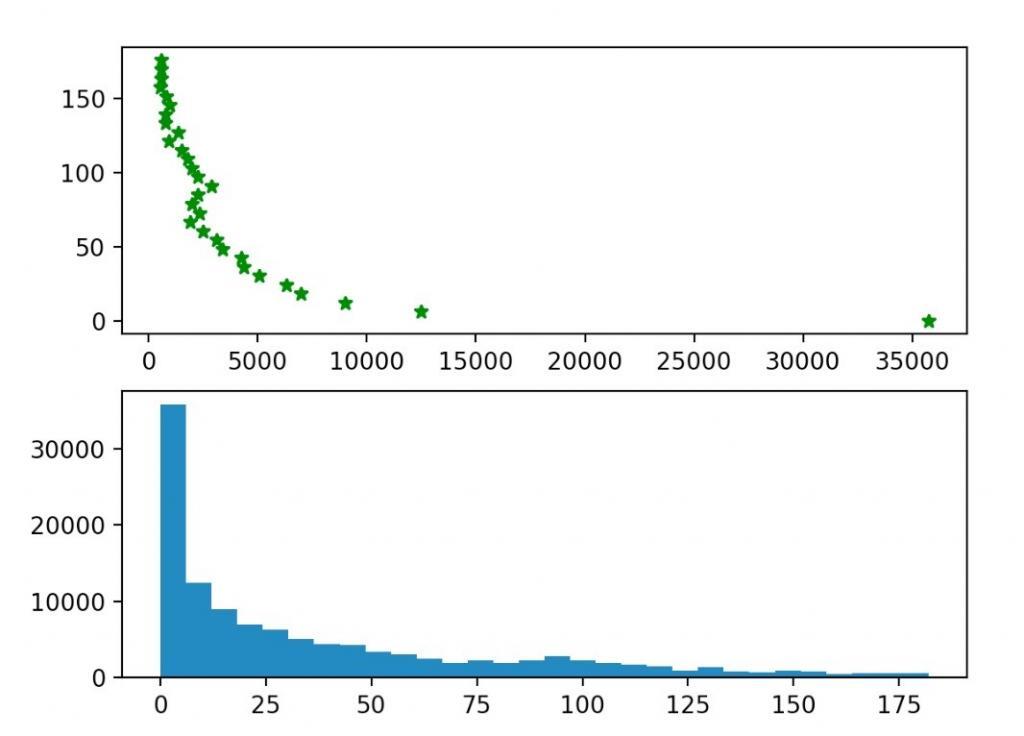 Histograms of Avg. Days Between Sessions for two different publishers.
Different Ways to Predict Churners
Once we completed these steps, we used logistic regression to classify users (churned vs. retained) and detect when a user is getting close to churning. We did that by simply uploading the CSV file into Amazon Machine Learning. Here are the results:
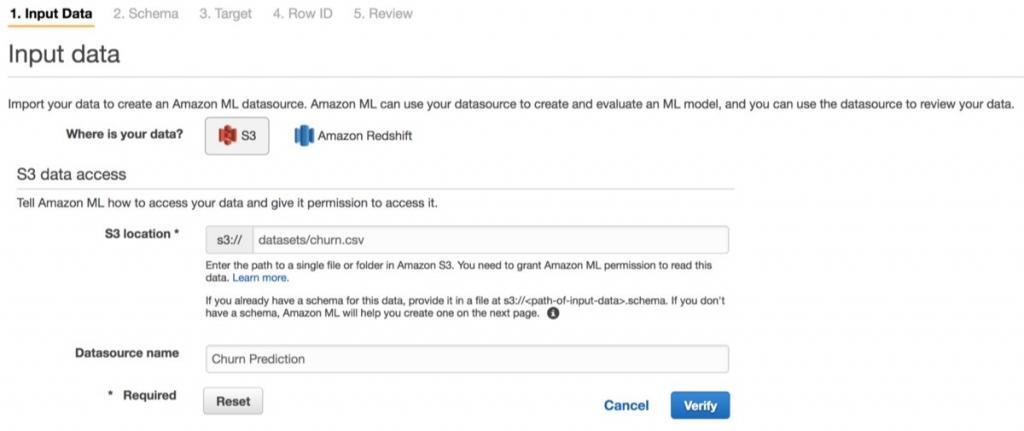
In the Create ML Model wizard from the Amazon ML console you can create the datasource and specify that the first line of the .csv file contains the column names.
Generally, Amazon ML automatically infers the data types of attributes, distinguishing between Binary, Categorical, Numeric, and Text attributes. You can correct incorrectly inferred types. After confirming the datasource to be used to create a model, we selected the target attribute: Churn. The wizard also asks about the identifier for each row.
In a practical application, you should supply an identifier for each data point–such as a customer ID–to tie the churn predictions back to the corresponding customers. Because this dataset doesn’t contain a natural ID, we chose No and proceeded to create the datasource.
As it creates the datasource, Amazon ML analyzes the data and computes basic statistics, such as correlating individual attributes to the target attribute and defining the range and distribution of the values.
It always pays to spend some time trying to understand the data you are working with.
Amazon ML automatically transforms all binary values, such as yes/no and True/False into corresponding 1/0 values.
Now that the datasource was set, we were ready to train the model. With Amazon ML, this can be as simple as clicking a button, pointing to the datasource, and choosing default configurations. By default, the service sets aside 30% of your training data for model evaluation and uses the other 70% to train the model.
Additionally, Amazon ML chooses default training parameters and uses a default data recipe for feature transformation prior to training. You can use the default settings, but if you carefully look at your data, supplying a custom recipe based on your insights might improve the accuracy of the model. This binary classification model actually produces a score between 0 and 1, instead of giving us a truly binary response.
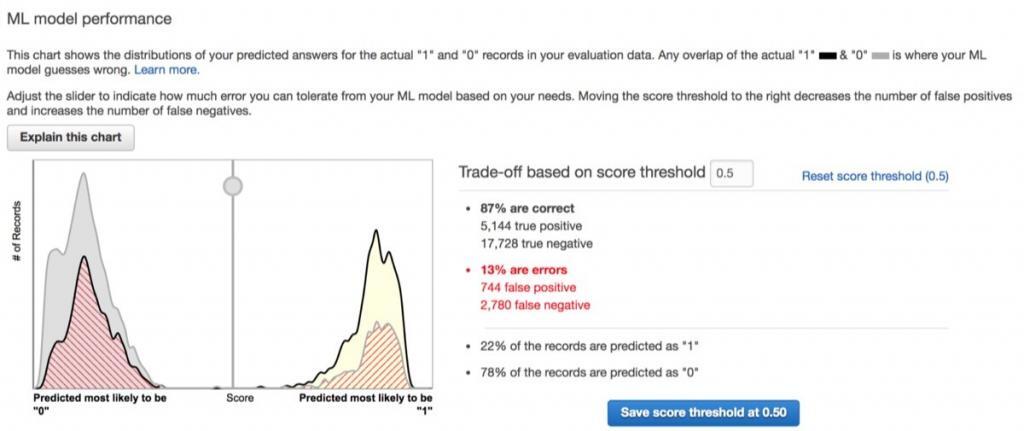
As you can see, we got an initial area under the curve (AUC) of nearly 0.844 which is considered very good for most machine learning applications. This gives us a chance to further tune predictions by selecting a threshold, or a cutoff score, that the service will use to give the final forecast.
By default, this threshold is set at 0.5. The Amazon ML console allows you to interactively change the threshold by showing you how a given setting affects the four statistics.
In this example, we clearly made many simplifying assumptions.
To realistically predict churn, you might want to take into account some the following issues
- Some customers who receive retention incentives will still churn.
- The evolution of customer behavior should be modeled as well. If reading time is dropping and the number of sessions is increasing, we are more likely to experience churn then if the trend is the opposite. A customer profile should incorporate behavioral trends.
- We didn’t assign any monetary cost to our training data and this is rarely the case when dealing with churn.
How to Curb Your Churn
Irrespective of how complex your context is, this churn prediction model provides useful leads worth investigating.
How can ad-based publishers prevent this from happening? How can they increase the lifetime of a loyal reader? What if they could predict when a certain reader is about to churn, empowering their team to be proactive instead of reactive?
As a digital publisher, you can experiment with various incentives and target the specific users who are at high risk to churn.
You can try:
- Exploring how satisfied they are with your content/format/etc. through polls and surveys
- Targeting them with ads on Facebook, Instagram or the Google Display Network in remarketing campaigns
- Determining the weaknesses that hinder your growth (ad placements, least read content, editorial focus, etc.)
- Discovering which additional services or content could serve your readers’ interests to keep them engaged for longer
- Using trigger-based emails once you’ve pinpointed specific affinities readers have
- Providing incentives for engagement and content consumption
- Reminding readers of your value and more.
The dominance of free information may have made it difficult for publishers to charge for their content but growth is still possible even without this leverage.
Our entire attention is focused on making that happen by building an AI-as-a-service platform and facilitating its integration with your existing setup. We strongly believe that machine learning and data science can support better online experiences that cater to both providers’ and consumers’ needs.
